The Withdrawn TEU Capacity from Blanked Sailings log featured on our home page was originally launched due to the massive number of blanked sailings earlier in 2020 as a result of the COVID-19 coronavirus.

Now that things have stabilized, we are discontinuing the report. Blanked sailings data can still be found using BlueWater Reporting’s Blanked Sailings Report, Blanked Sailings Analysis or Blanked Sailings Pivot Table Report.

However, if you are interested in receiving data in this format going forward, please contact us.

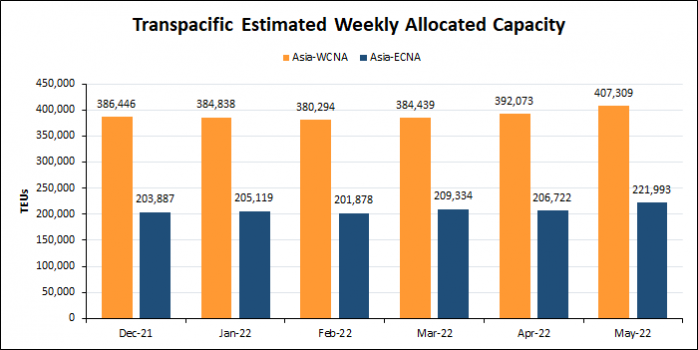
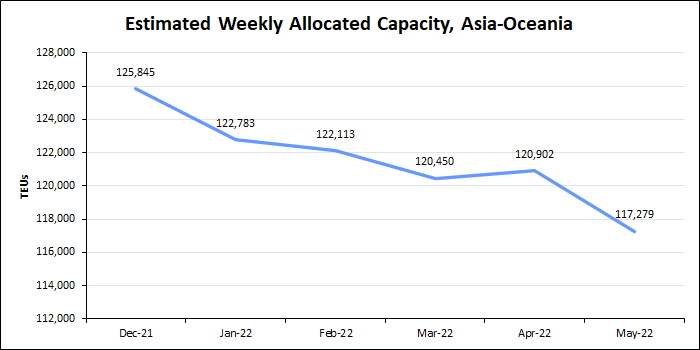
Blanked Sailings on Major Asia Outbound Trades

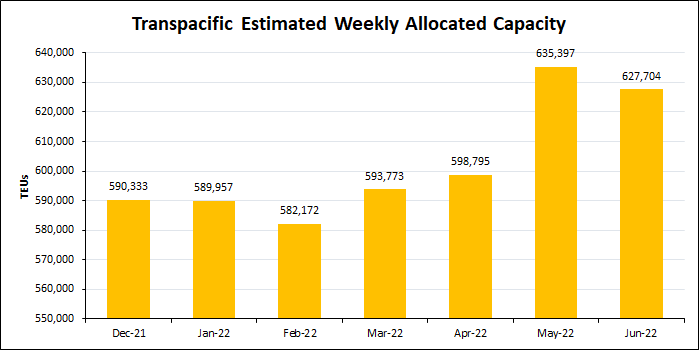
Avg. Weekly Deployed TEUs on trade, Asia to N. America: 439,116
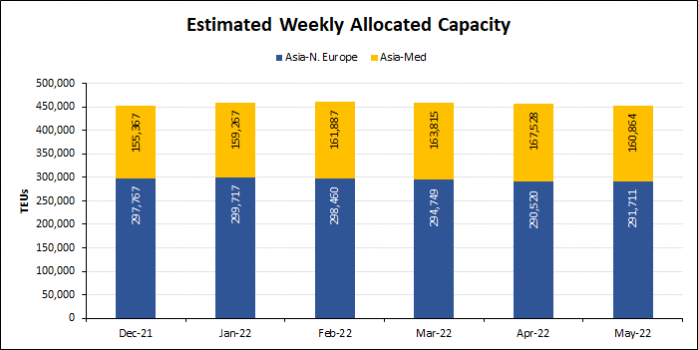
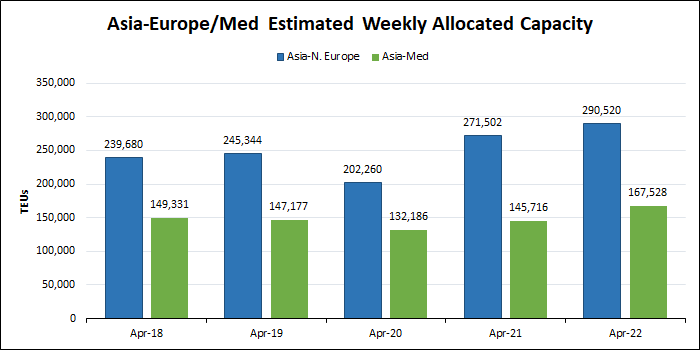
Avg. Weekly Deployed TEUs on trade, Asia to N. Europe/Med: 378,744
TodayTuesday March 19, 2024
38 Liner Vessels
are scheduled to arrive in Shekou Shenzhen CN.
Browse.
Search Reports, Applications, Dashboards, & More.
1 2
 
June transpacific capacity slightly decreases since the previous month
The Capacity Report shows a slight decrease in transpacific capacity from Asia to North America to 627,704 TEUs, as of the latest week of June 2022, from the month prior.
Asia to Oceania capacity grows 18 percent year-over-year
According to the Capacity Report, the capacity from Asia to Oceania has grown by 18.3 percent from June 2021 to June 2022.
Hapag-Lloyd has the greatest transatlantic capacity from North Europe, MSC has greatest from the Mediterranean
The Carrier Trade Route Deployment Report shows a 23,597 TEU capacity for Hapag-Lloyd from N. Europe to N. America and MSC has a capacity of 41,061 TEUs from Med. to N. America.
Asia to Mediterranean capacity decreases as Asia to North Europe capacity stabilizes
The Capacity Report shows a 4 percent decrease in capacity from Asia to the Mediterranean at the end of May 2022 and a very slight increase of 0.4 percent in the Asia to North Europe capacity.
Transpacific capacity rises in May
The capacity report shows a 5.4 percent increase along the Asia to West Coast North America trade route and an 8.9 percent increase on the Asia to East Coast North America route from December 2021 to May 2022.
Capacity from Asia to Oceania drops in the new year
From the last week of December 2021 to the latest week of May 2022, the Capacity Report shows a 7 percent decrease in capacity on the Asia to Oceania trade route.
Transatlantic capacity from North Europe to North America increases in April
The Capacity Report shows a 12.3 percent increase in North Europe to North America capacity from March 2022 to April 2022, and only a 0.4 percent increase from the Mediterranean to North America.
Asia capacity to Europe and the Mediterranean increases year-over-year
The Capacity Report shows a year-over-year increase in capacity of 7 percent from Asia to North Europe and 15 percent from Asia to the Mediterranean from April 2021 to April 2022.
Year-over-year changes in the Oceania trades
The Capacity Report shows the estimated weekly allocated capacity changes to the major Oceania trades, with Asia to Oceania increasing by 8 percent from the year prior.
Hapag-Lloyd dominates capacity along the transatlantic route
The chart using Carrier Trade Route Deployment Report lists the largest carriers by their transatlantic capacity with Hapag-Lloyd deploying the greatest capacity of 23,546 TEUs.


Blanked Sailings China to North America

 
Powered By